Displays graphical representations and direct links to reporting for all sales/accounts receivable information.
Graphical Representations Include:1. AR/AR Aging
2. Invoices/Open Invoices
3. Sales Comparisons for up to 2 previous years
4. Sales Comparisons by customer and service
AR Dashboard
Overview
AR Manager
-
AR Aging
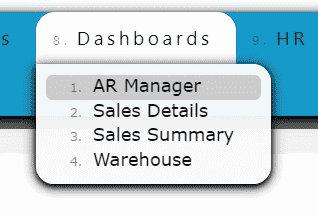
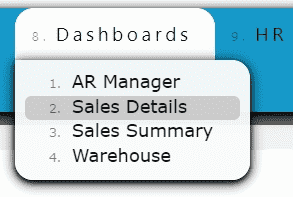
1. Go to the Dashboards Menu and click on the AR Manager Sub-Menu
2. Scroll down to view graphical representation for AR Aging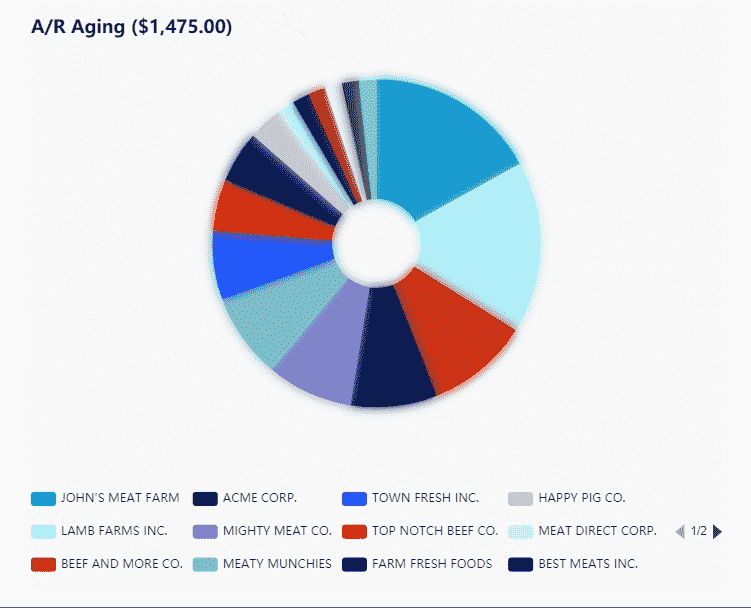
3. Use the left and right arrows to identify each customer's color slice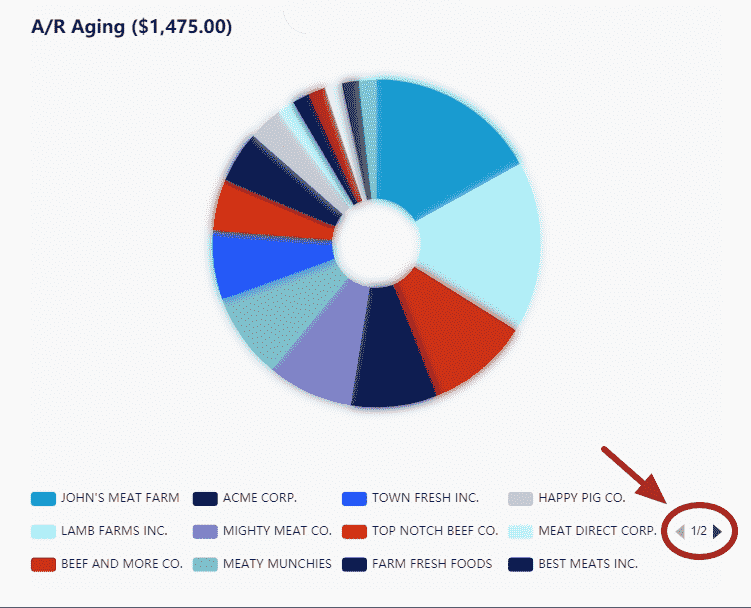
4. Click on any customer name to omit it's entry from the graph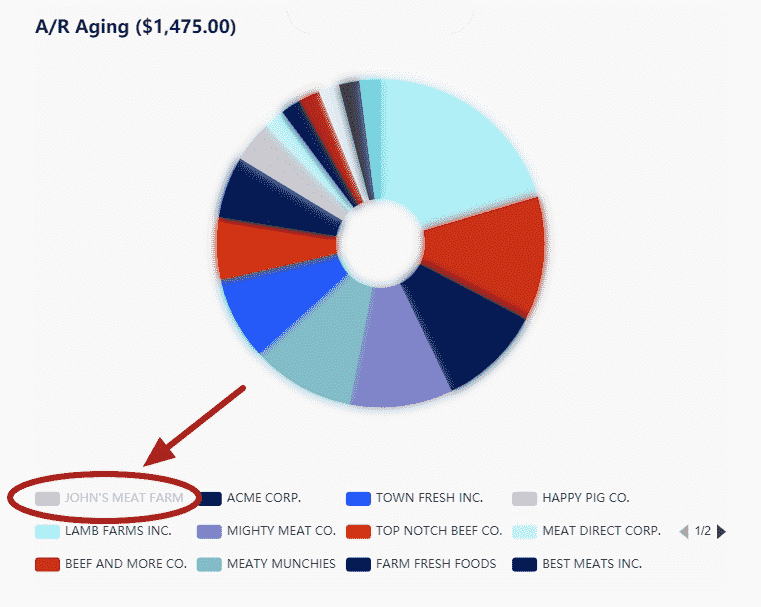
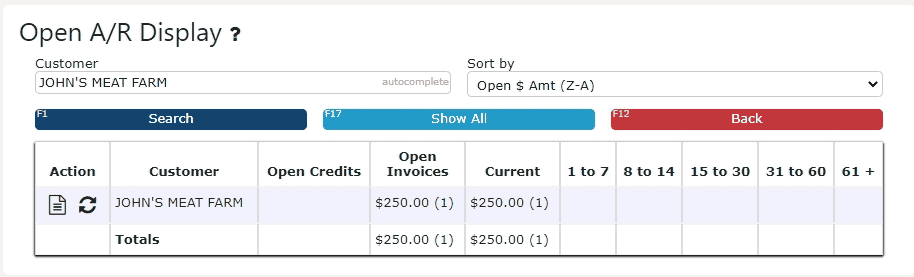
5. Click on any pie slice to be redirected to the AR Aging Report for that particular customer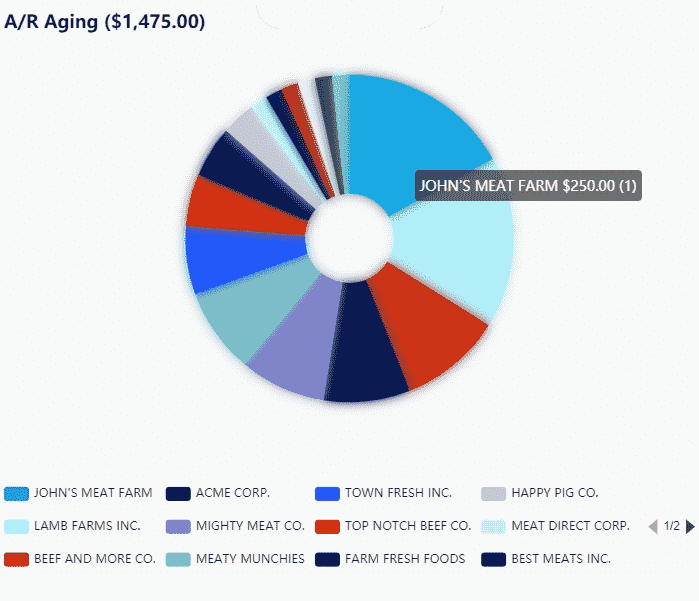
-
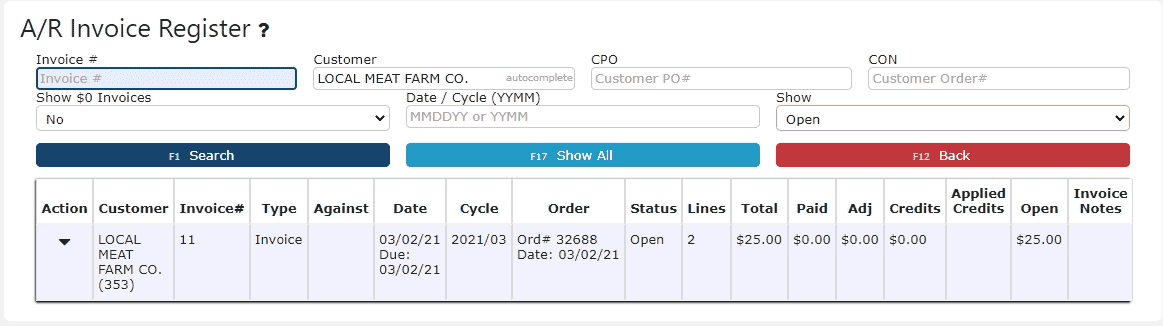
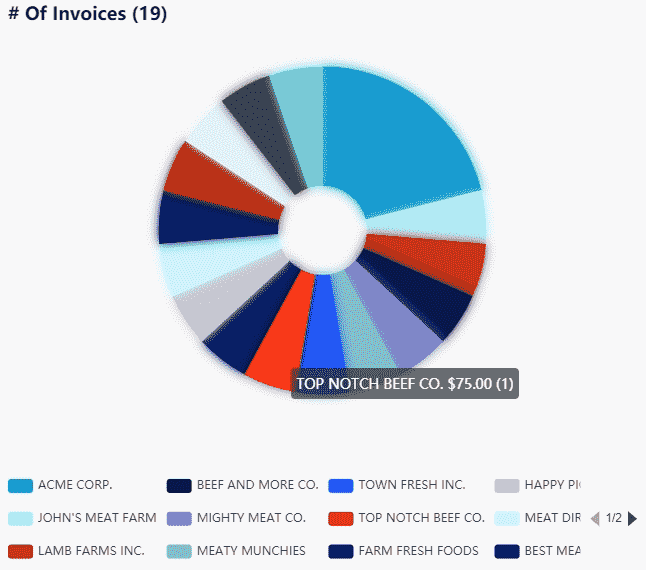
Number of Open Invoices
1. Go to the Dashboards Menu and click on the AR Manager Sub-Menu2. Scroll down to view graphical representation for the Number of Open Invoices
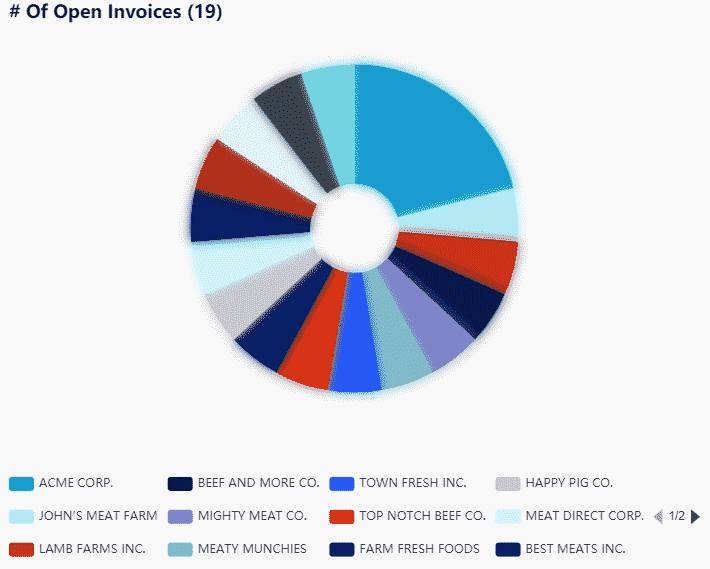 3. Use the left and right arrows to identify each customer's color slice
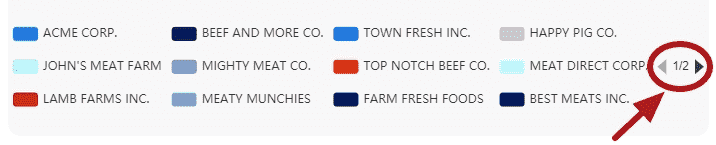
4. Click on any customer name to omit it's entry from the graph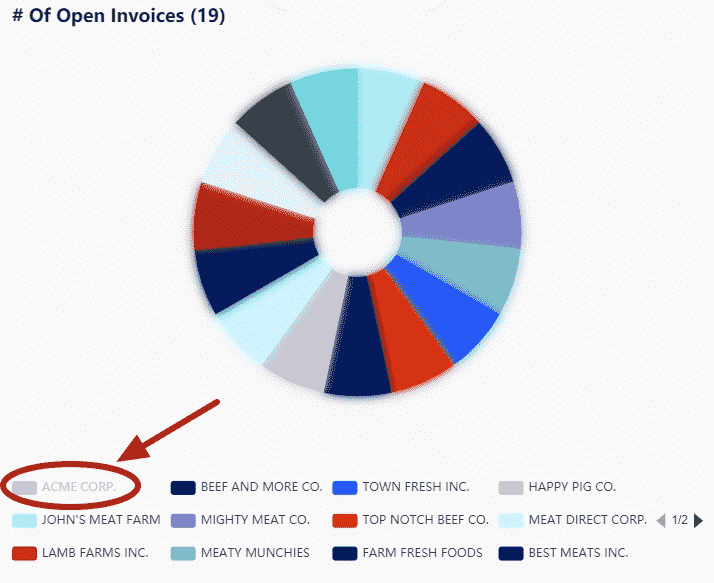 5. Click on any pie slice to be redirected to the AR Invoice Register screen for that particular customer
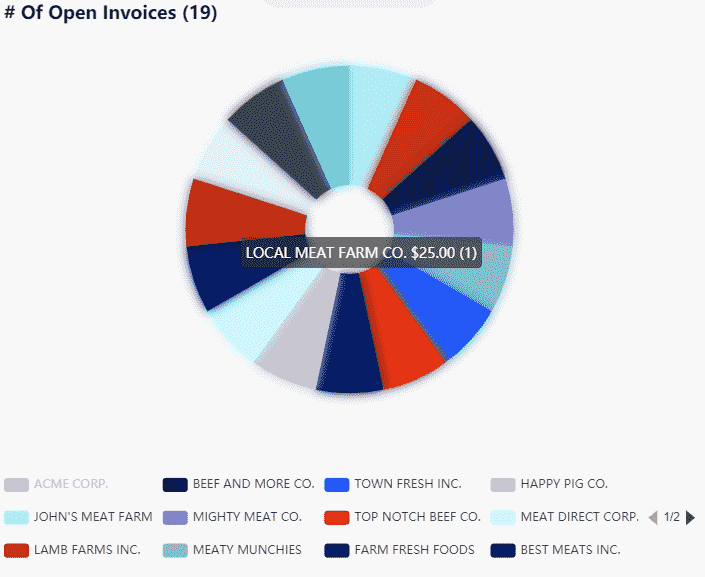
-
Total AR
1. Go to the Dashboards Menu and click on the AR Manager Sub-Menu2. Scroll down to view graphical representation for Total AR
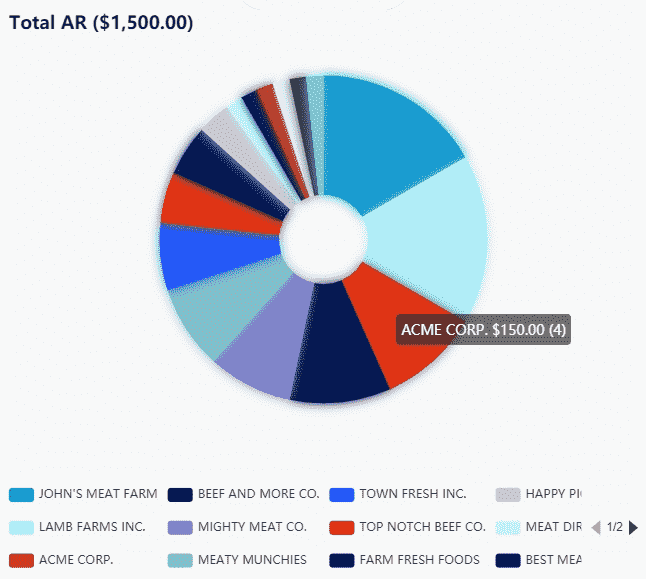 3. Use the left and right arrows to identify each customer's color slice
4. Click on any customer name to omit it's entry from the graph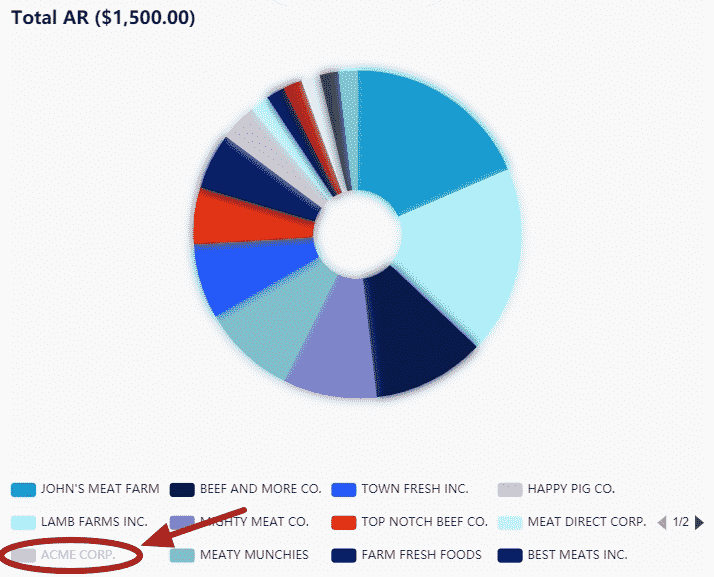 5. Click on any pie slice to be redirected to the AR Report for that particular customer
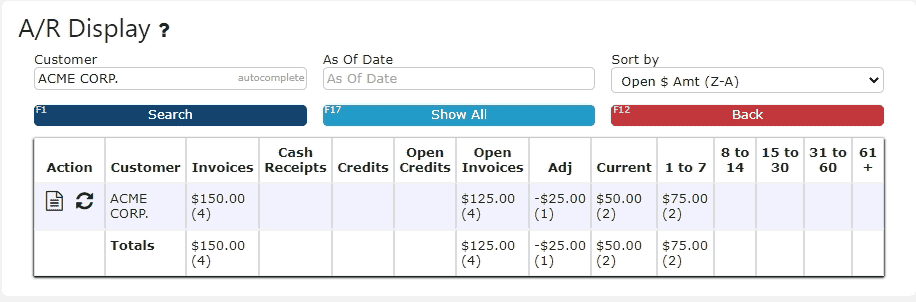
-
Number of Invoices
1. Go to the Dashboards Menu and click on the AR Manager Sub-Menu2. Scroll down to view graphical representation for the Number of Invoices per customer
 3. Use the left and right arrows to identify each customer's color slice
4. Click on any customer name to omit it's entry from the graph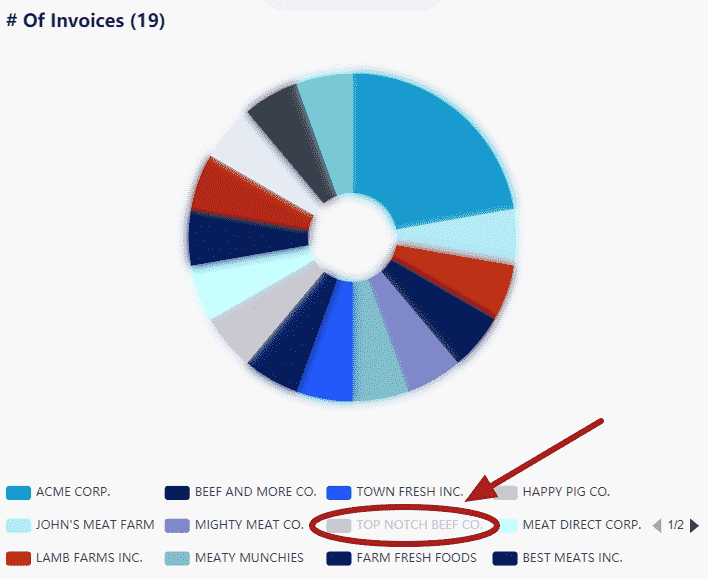 5. Click on any pie slice to be redirected to the AR Invoice Register screen for that particular customer
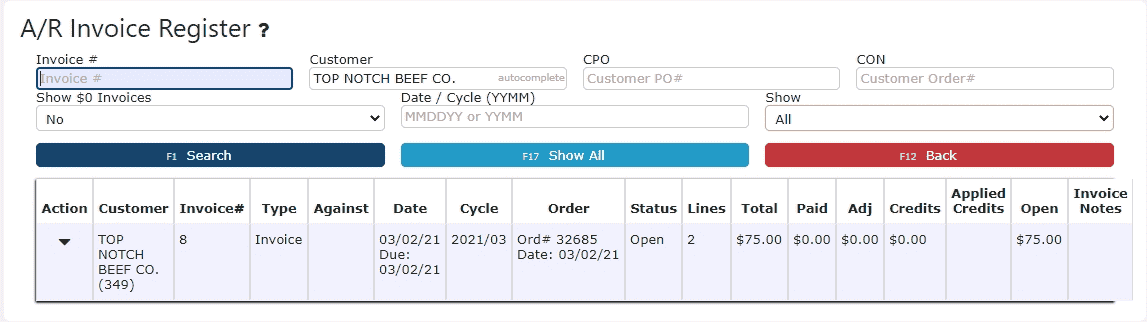
Sales Details
-
Last Year's to Date Sales by Service
1. Go to the Dashboards Menu and click on the Sales Details Sub-Menu
 2. Scroll down to view the graphical representation for Last Year's to Date Sales organized by service (Sales up until today's day date for the year prior)
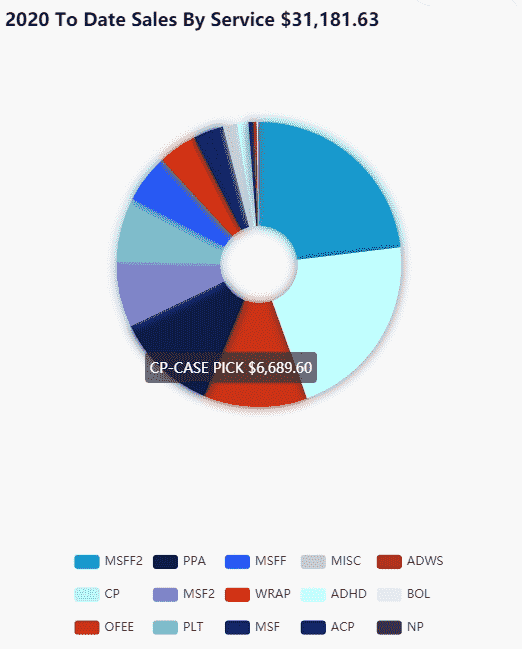 3. Use the left and right arrows to identify each service's color slice
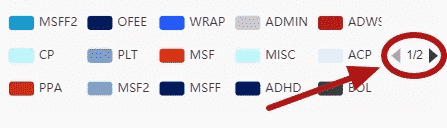
4. Click on any service name to omit it's entry from the graph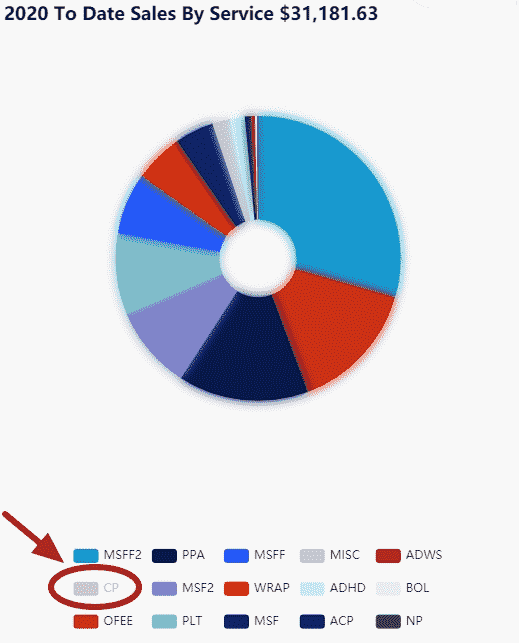 5. Click on any pie slice to be redirected to the Sales Daily Report for that particular service
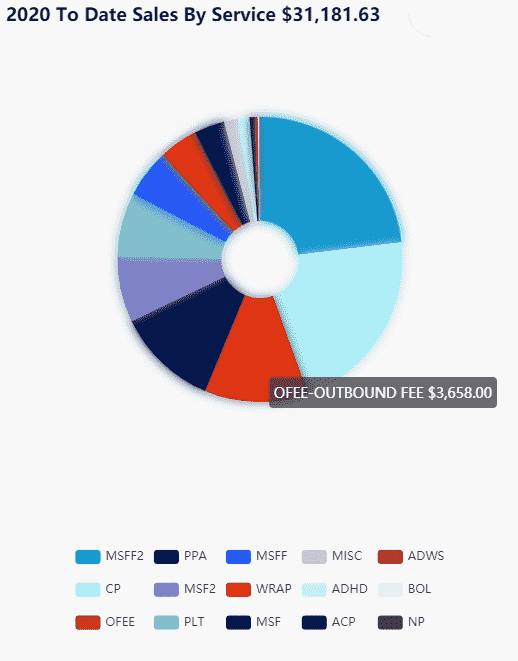
-
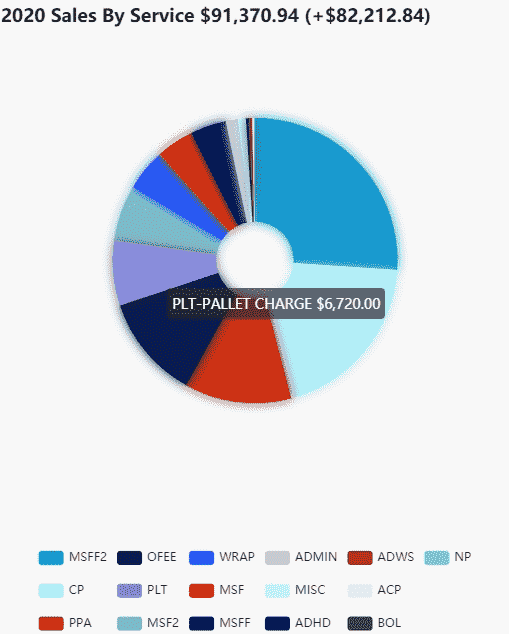
Year to Date Sales by Service
1. Go to the Dashboards Menu and click on the Sales Details Sub-Menu2. Scroll down to view graphical representation for the Year to Date Sales by Service
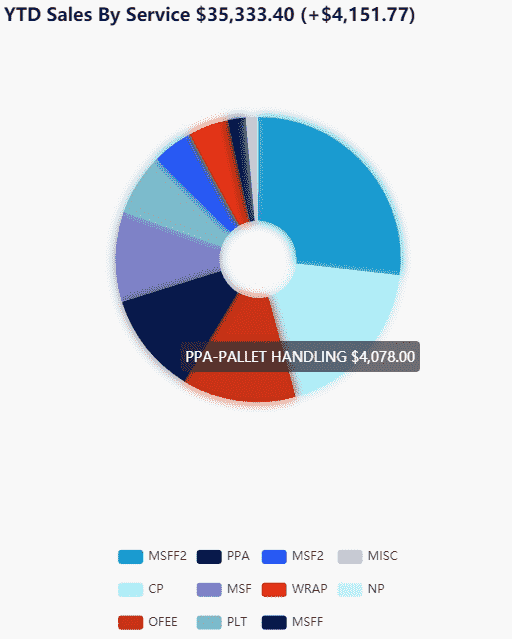 3. Use the left and right arrows to identify each service's color slice
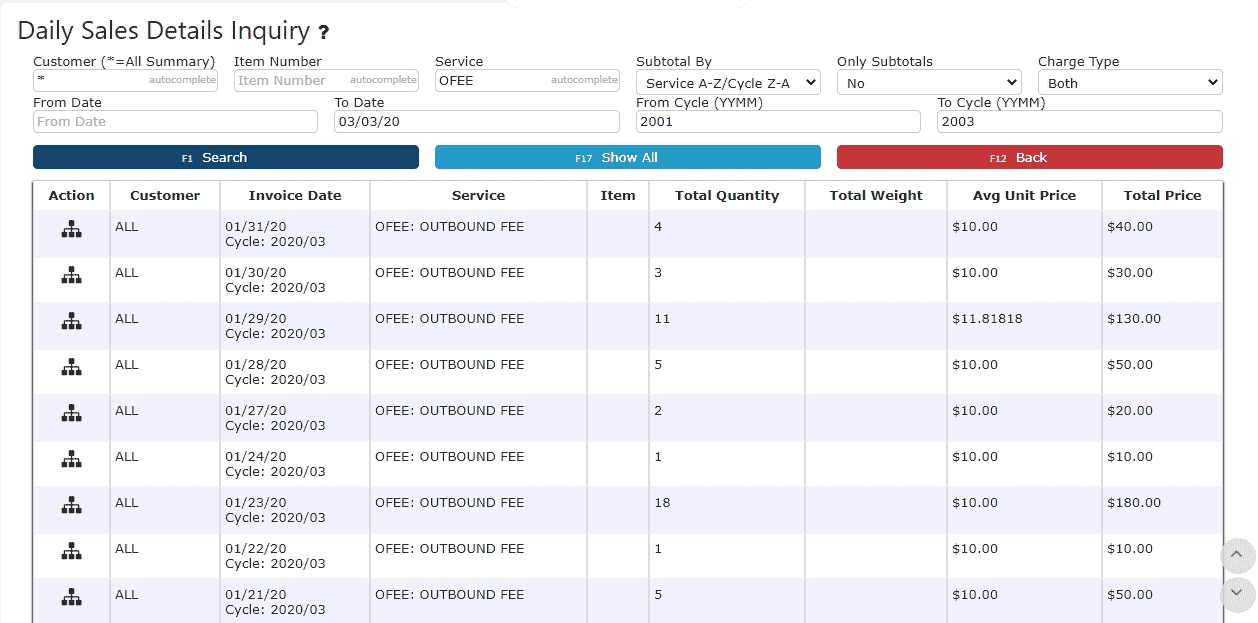
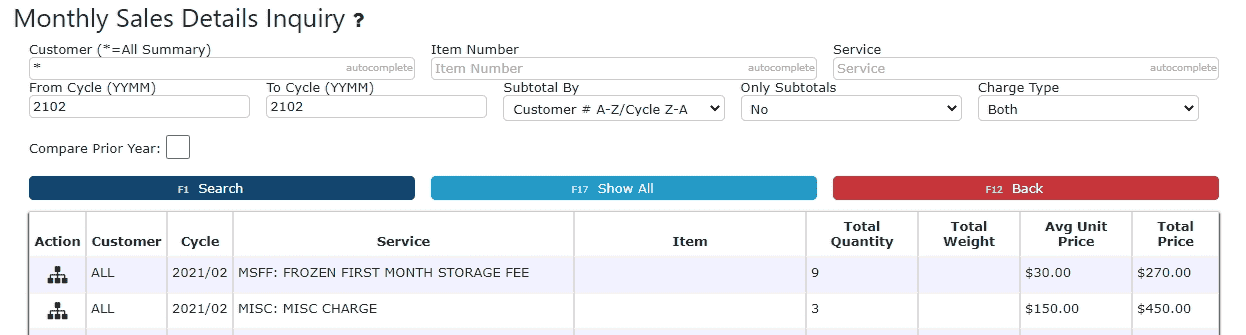
4. Click on any service name to omit it's entry from the graph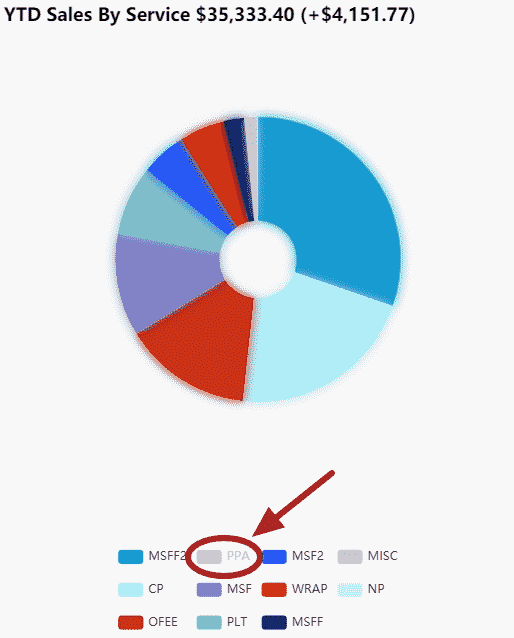 5. Click on any pie slice to be redirected to the Sales Monthly Report for that particular service
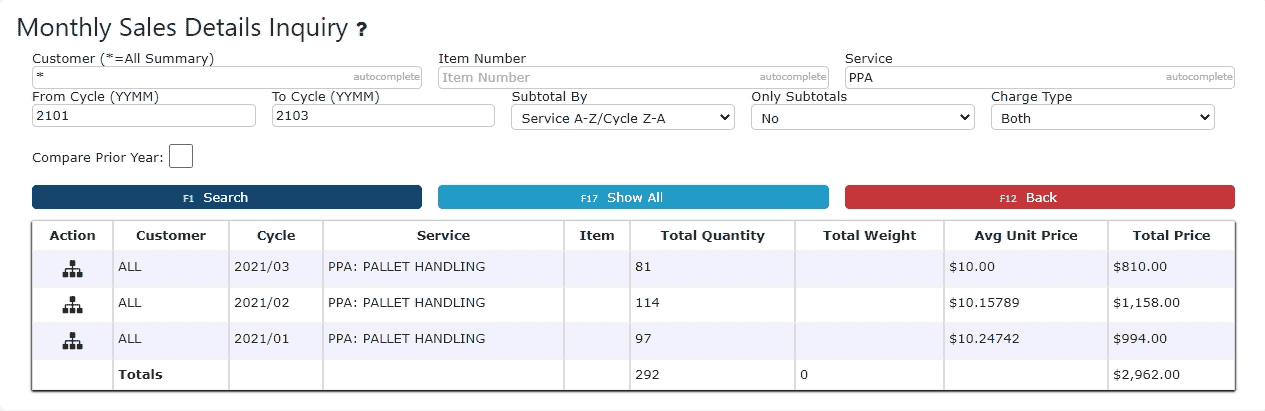
-
2 Years Prior Sales by Service
1. Go to the Dashboards Menu and click on the Sales Details Sub-Menu2. Scroll down to view the graphical representation for the sales for the year prior to the previous year, organized by service
 3. Use the left and right arrows to identify each service's color slice
4. Click on any service name to omit it's entry from the graph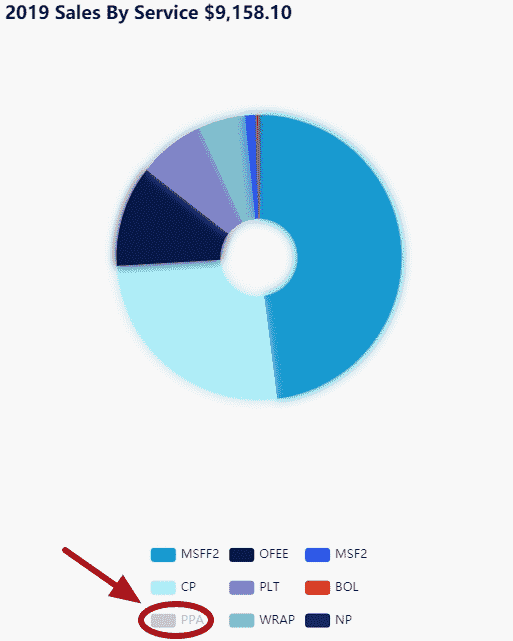 5. Click on any pie slice to be redirected to the Sales Monthly Report for that particular service
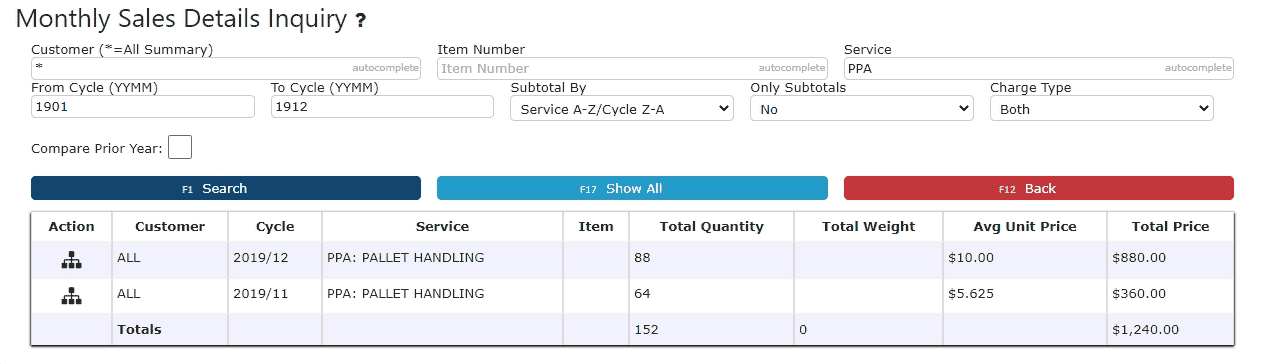
-
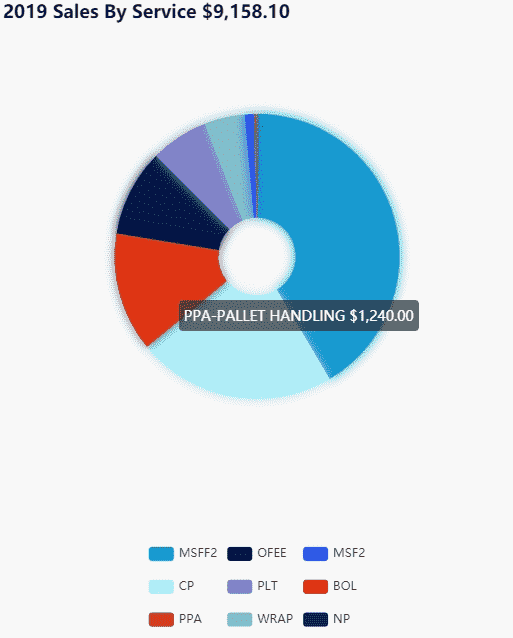
1 Year Prior Sales by Service
1. Go to the Dashboards Menu and click on the Sales Details Sub-Menu2. Scroll down to view the graphical representation for the sales for the previous year, organized by service
 3. Use the left and right arrows to identify each service's color slice
4. Click on any service name to omit it's entry from the graph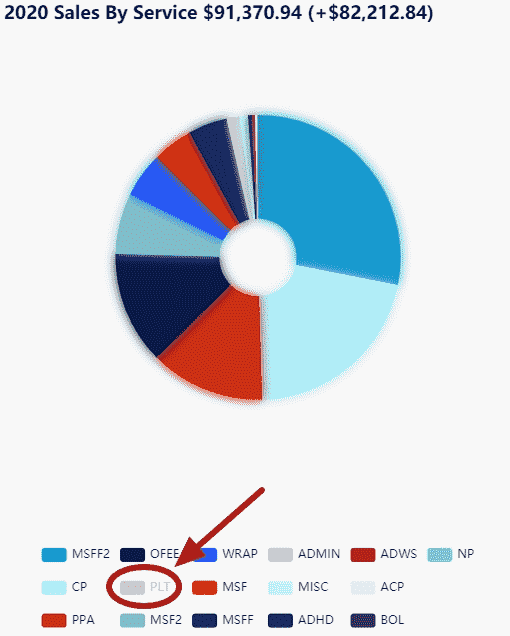 5. Click on any pie slice to be redirected to the Sales Monthly Report for that particular service
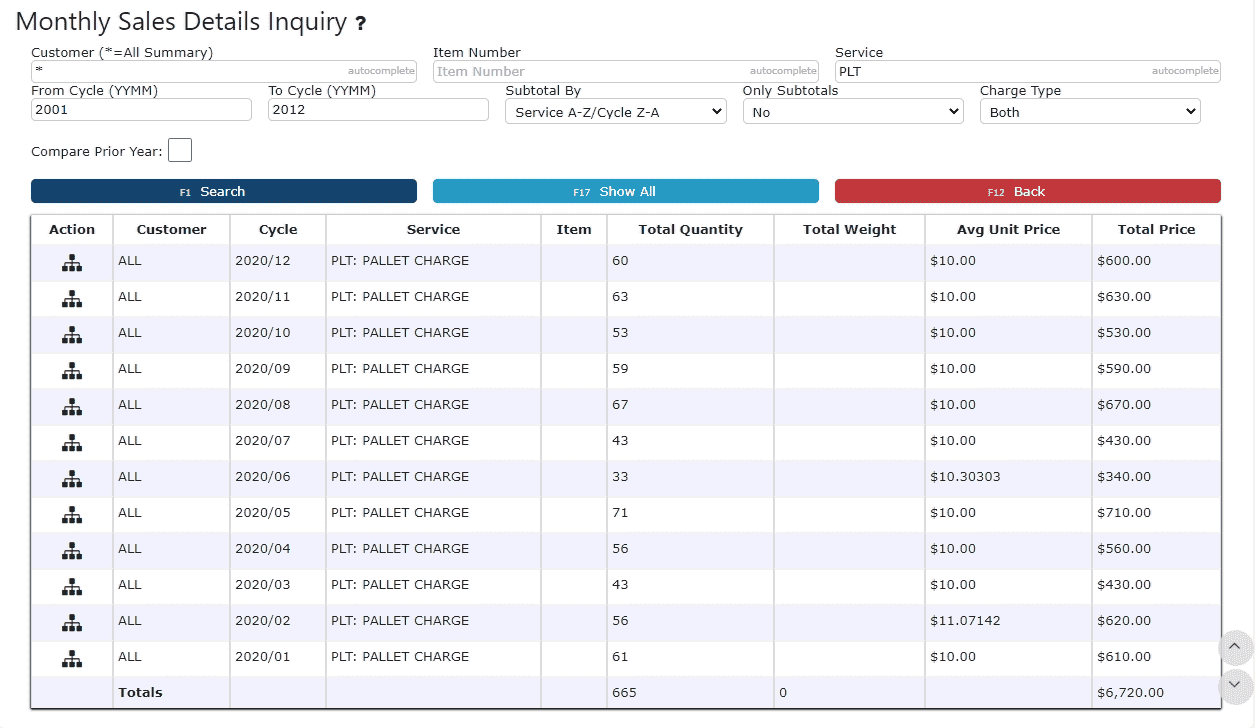
Sales Summary
-
Last Year's to Date Sales Monthly
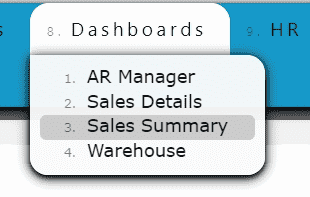
1. Go to the Dashboards Menu and click on the Sales Summary Sub-Menu
 2. Scroll down to view a graphical representation for Last Year's to Date Sales, plotted on a monthly basis (Sales up until today's day date for the year prior)
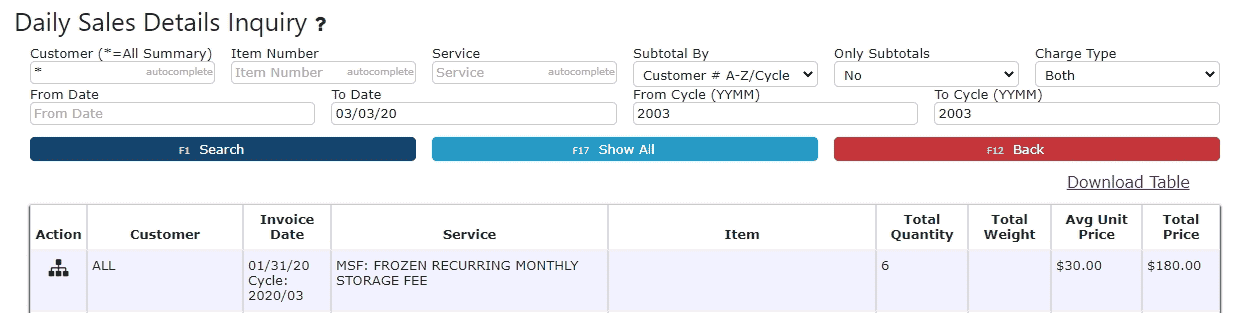
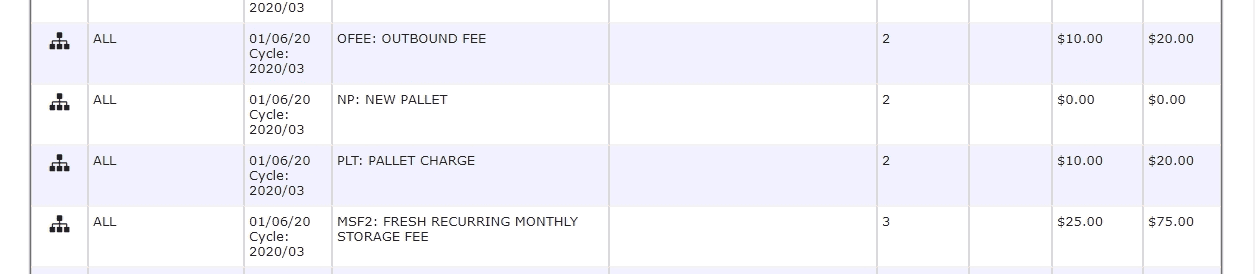
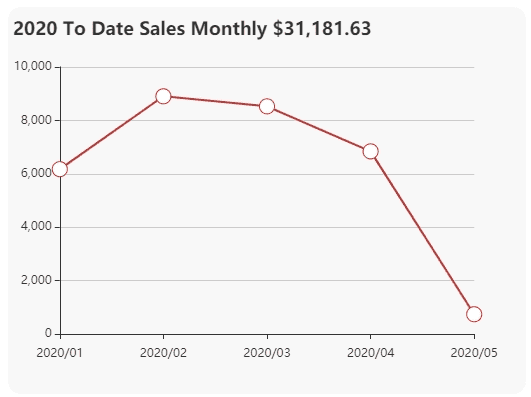 3. Click on any plotted point on the graph to be redirected to the Sales Daily Report
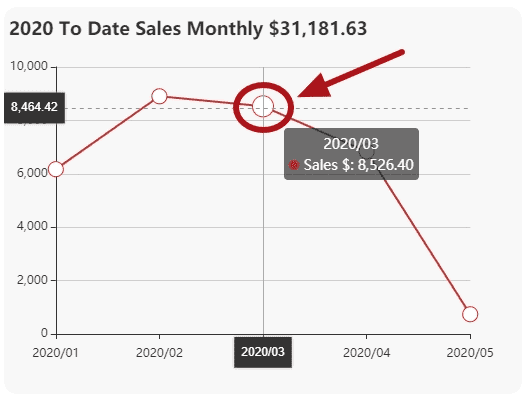
-
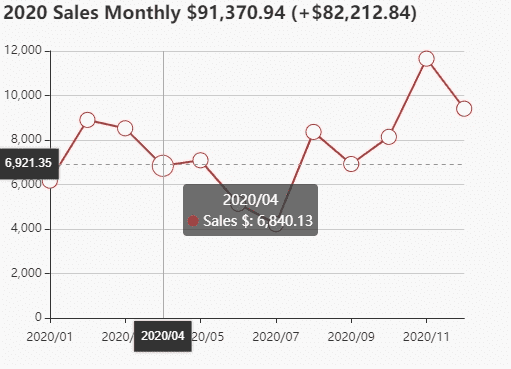
Year to Date Sales Monthly
1. Go to the Dashboards Menu and click on the Sales Summary Sub-Menu2. Scroll down to view a graphical representation for this Year's to Date Sales plotted on a monthly basis
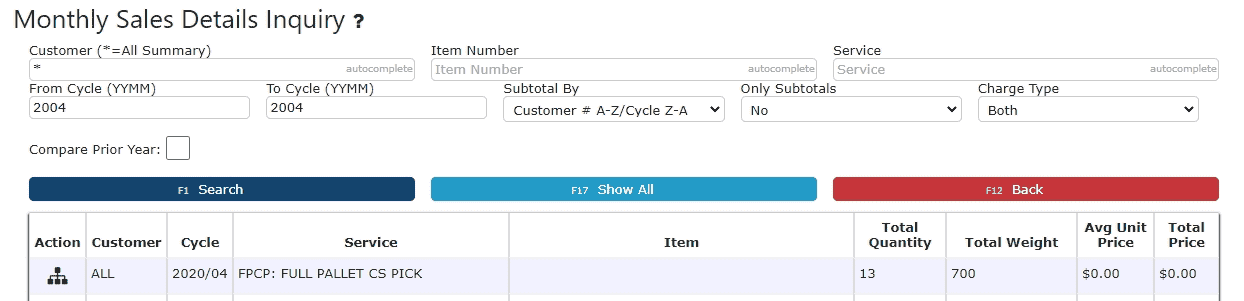
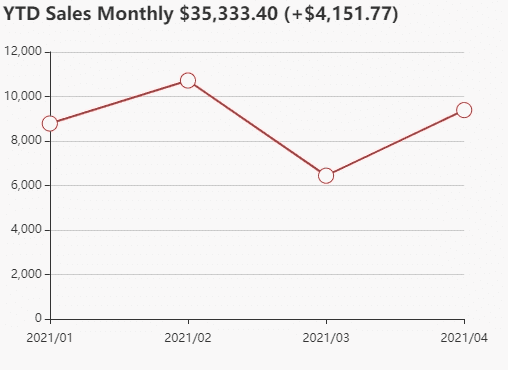 3. Click on any plotted point on the graph to be redirected to the Sales Monthly Report
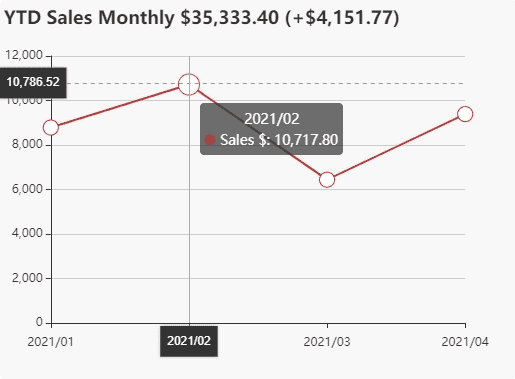
-
Last Year's to Date Sales by Customer
1. Go to the Dashboards Menu and click on the Sales Summary Sub-Menu2. Scroll down to view a graphical representation for Last Year's to Date Sales (Sales up until today's day date for the year prior), organized by customer
 3. Use the left and right arrows to identify each customer's color slice
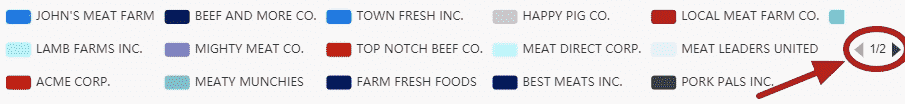
4. Click on any customer name to omit it's entry from the graph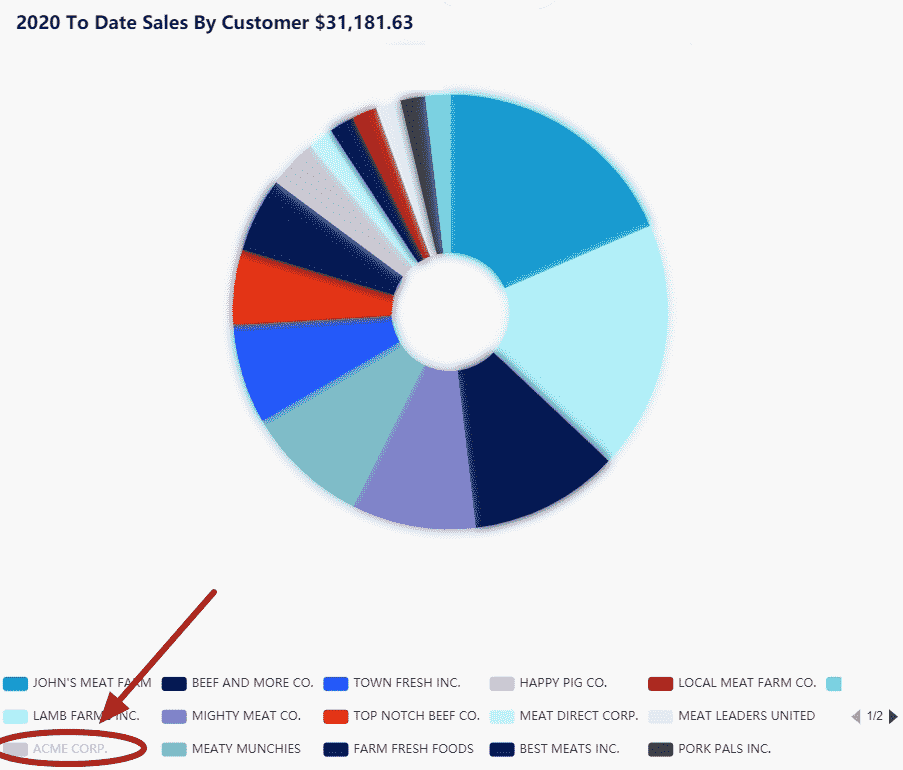 5. Click on any pie slice to be redirected to the Sales Daily Report for that particular customer
-
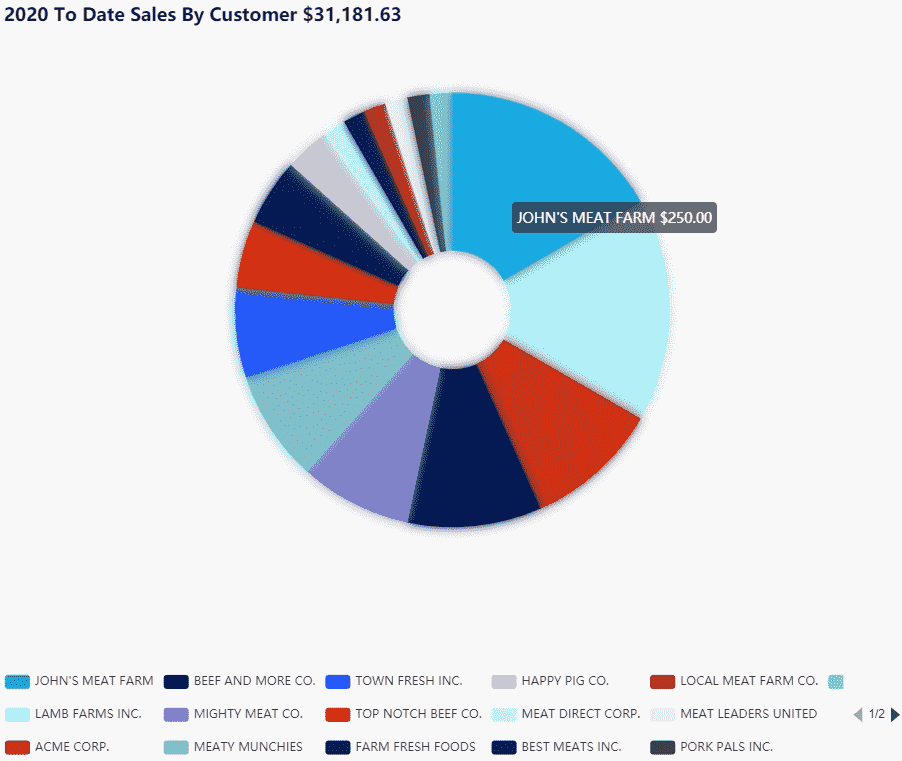
Year to Date Sales by Customer
1. Go to the Dashboards Menu and click on the Sales Summary Sub-Menu2. Scroll down to view the graphical representation for the sales for this year's to date sales, organized by customer
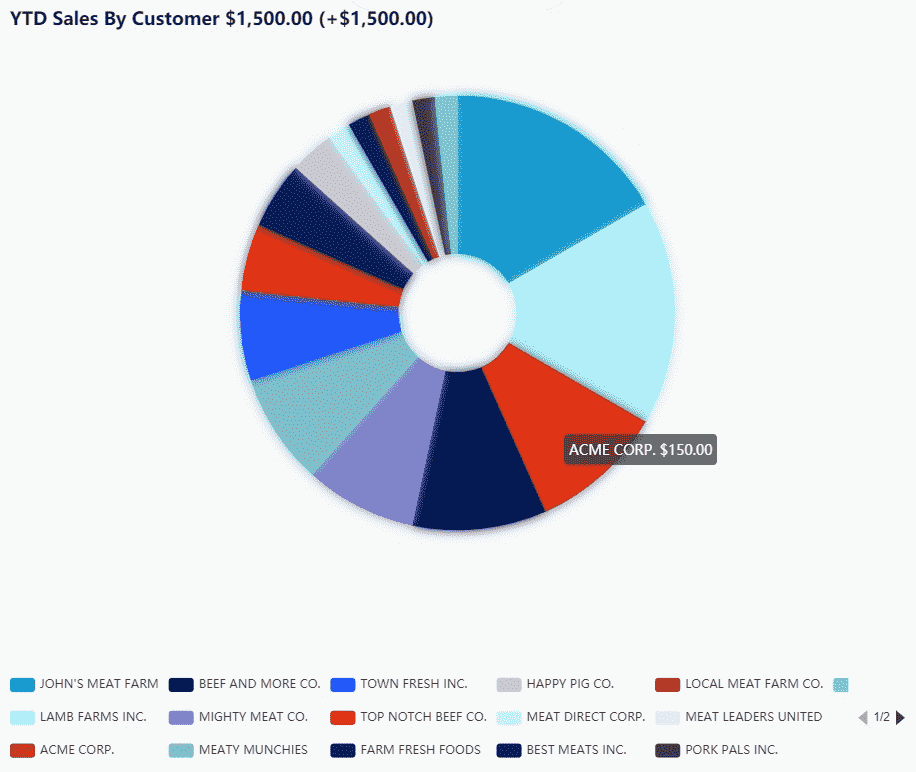 3. Use the left and right arrows to identify each customer's color slice
4. Click on any customer name to omit it's entry from the graph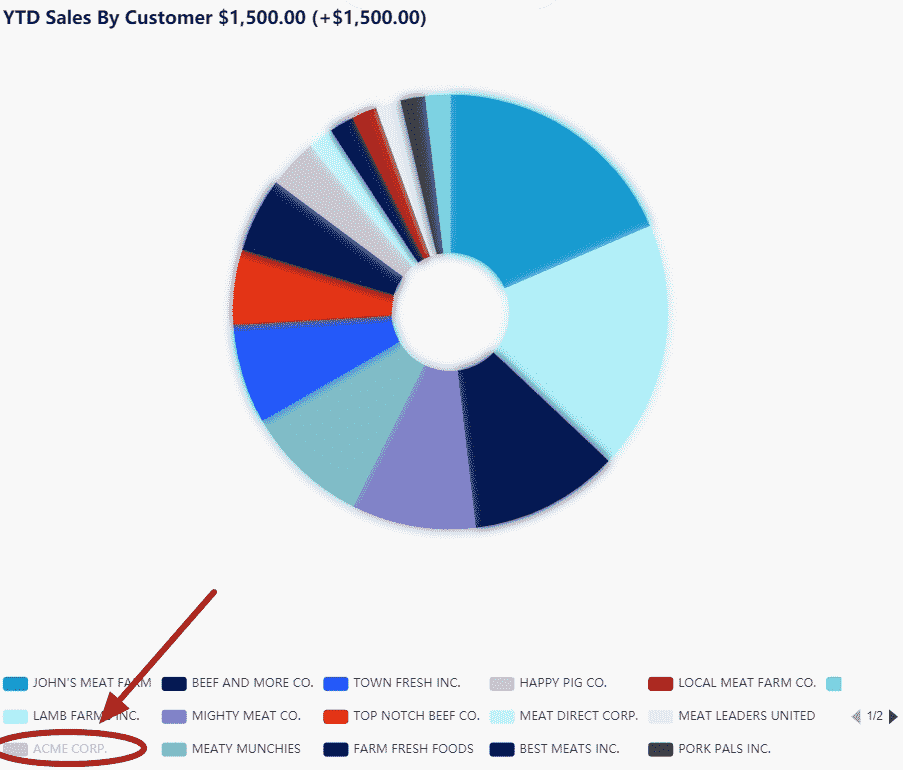 5. Click on any pie slice to be redirected to the Sales Monthly Report for that particular customer
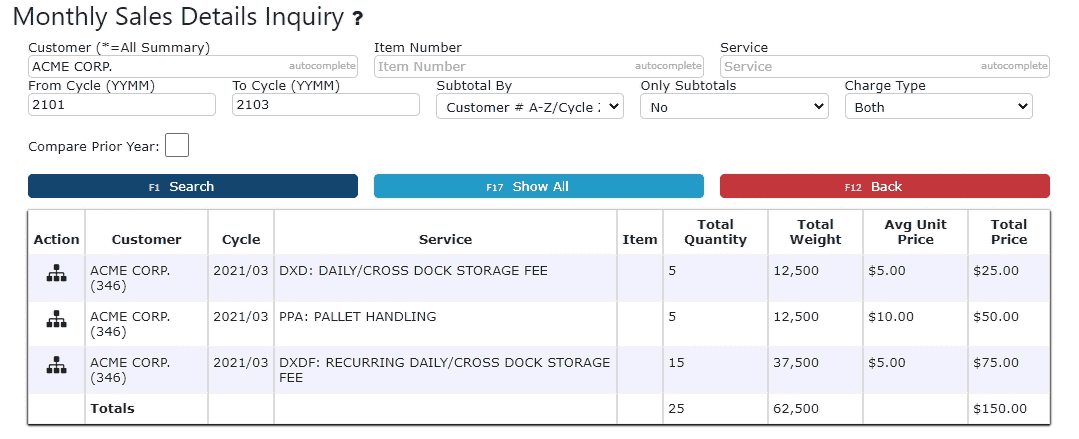
-
2 Years Prior Sales Monthly
1. Go to the Dashboards Menu and click on the Sales Summary Sub-Menu2. Scroll down to view the graphical representation for the sales for the year prior to the previous year, plotted on a monthly basis
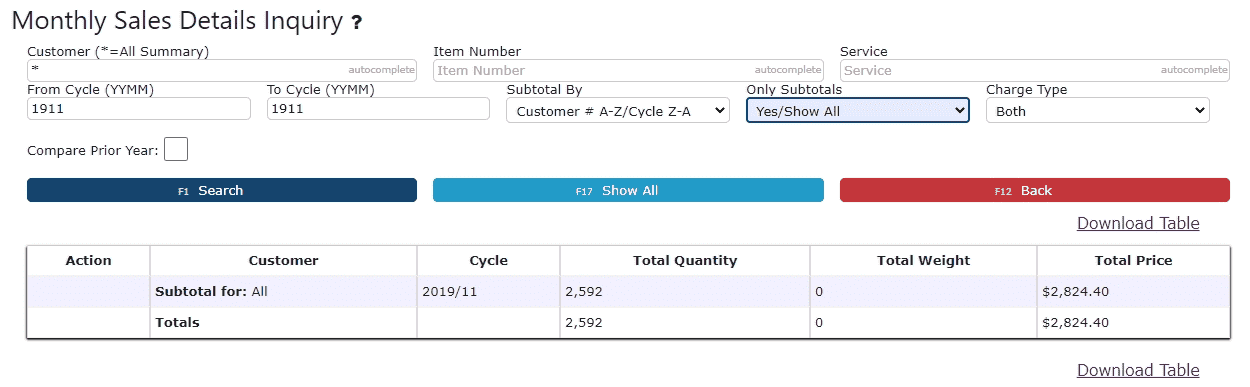
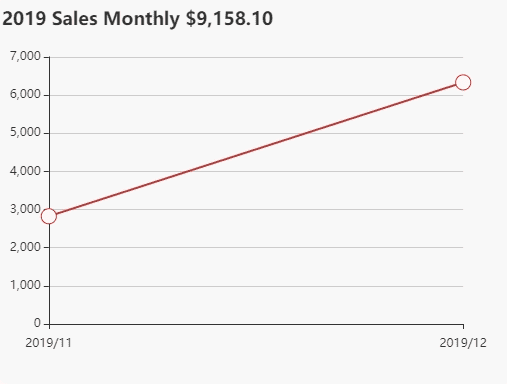 3. Click on any plotted point on the graph to be redirected to the Sales Monthly Report
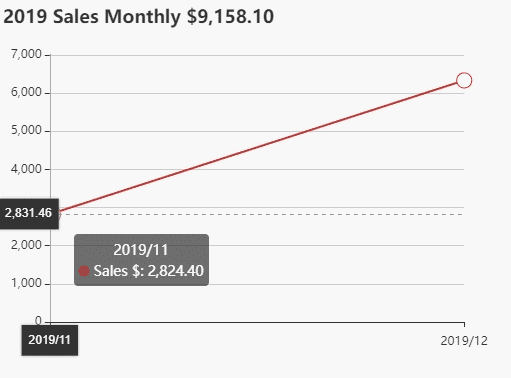
-
1 Year Prior Sales Monthly
1. Go to the Dashboards Menu and click on the Sales Summary Sub-Menu 2. Scroll down to view the graphical representation for the sales for the previous year, plotted on a monthly basis
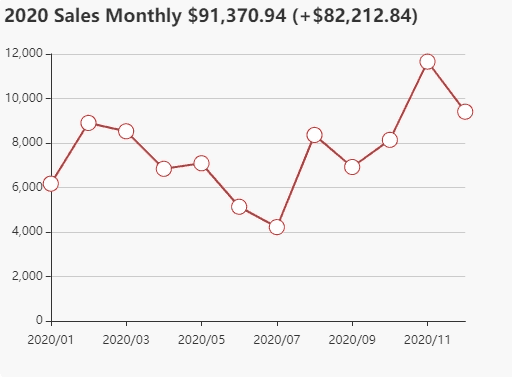
3. Click on any plotted point on the graph to be redirected to the Sales Monthly Report